Introduction
Growth of three plant species (oil palm, soybean and sunflower) was analysed by measuring the leaf surface. Determining plant mass, being destructive, was avoided. But the increase in leaf surface is a well-known good indication of the increase in mass, as leaf surface intercepts light making the photosynthesis, i.e. the production of plant mass, possible.
Leaf number was also recorded. It was therefore possible to analyse the leaf area as a product of two components, leaf number and average surface per leaf, see next formula.
yTA(t) = nL(t) x yLA(t) (18)
where:
yTA(t) = total leaf area per plant as a function of time (cm2)
nL(t) = number of leaves per plant as function of time (-)
yLA(t) = average surface per leaf as function of time (cm2)
Methods
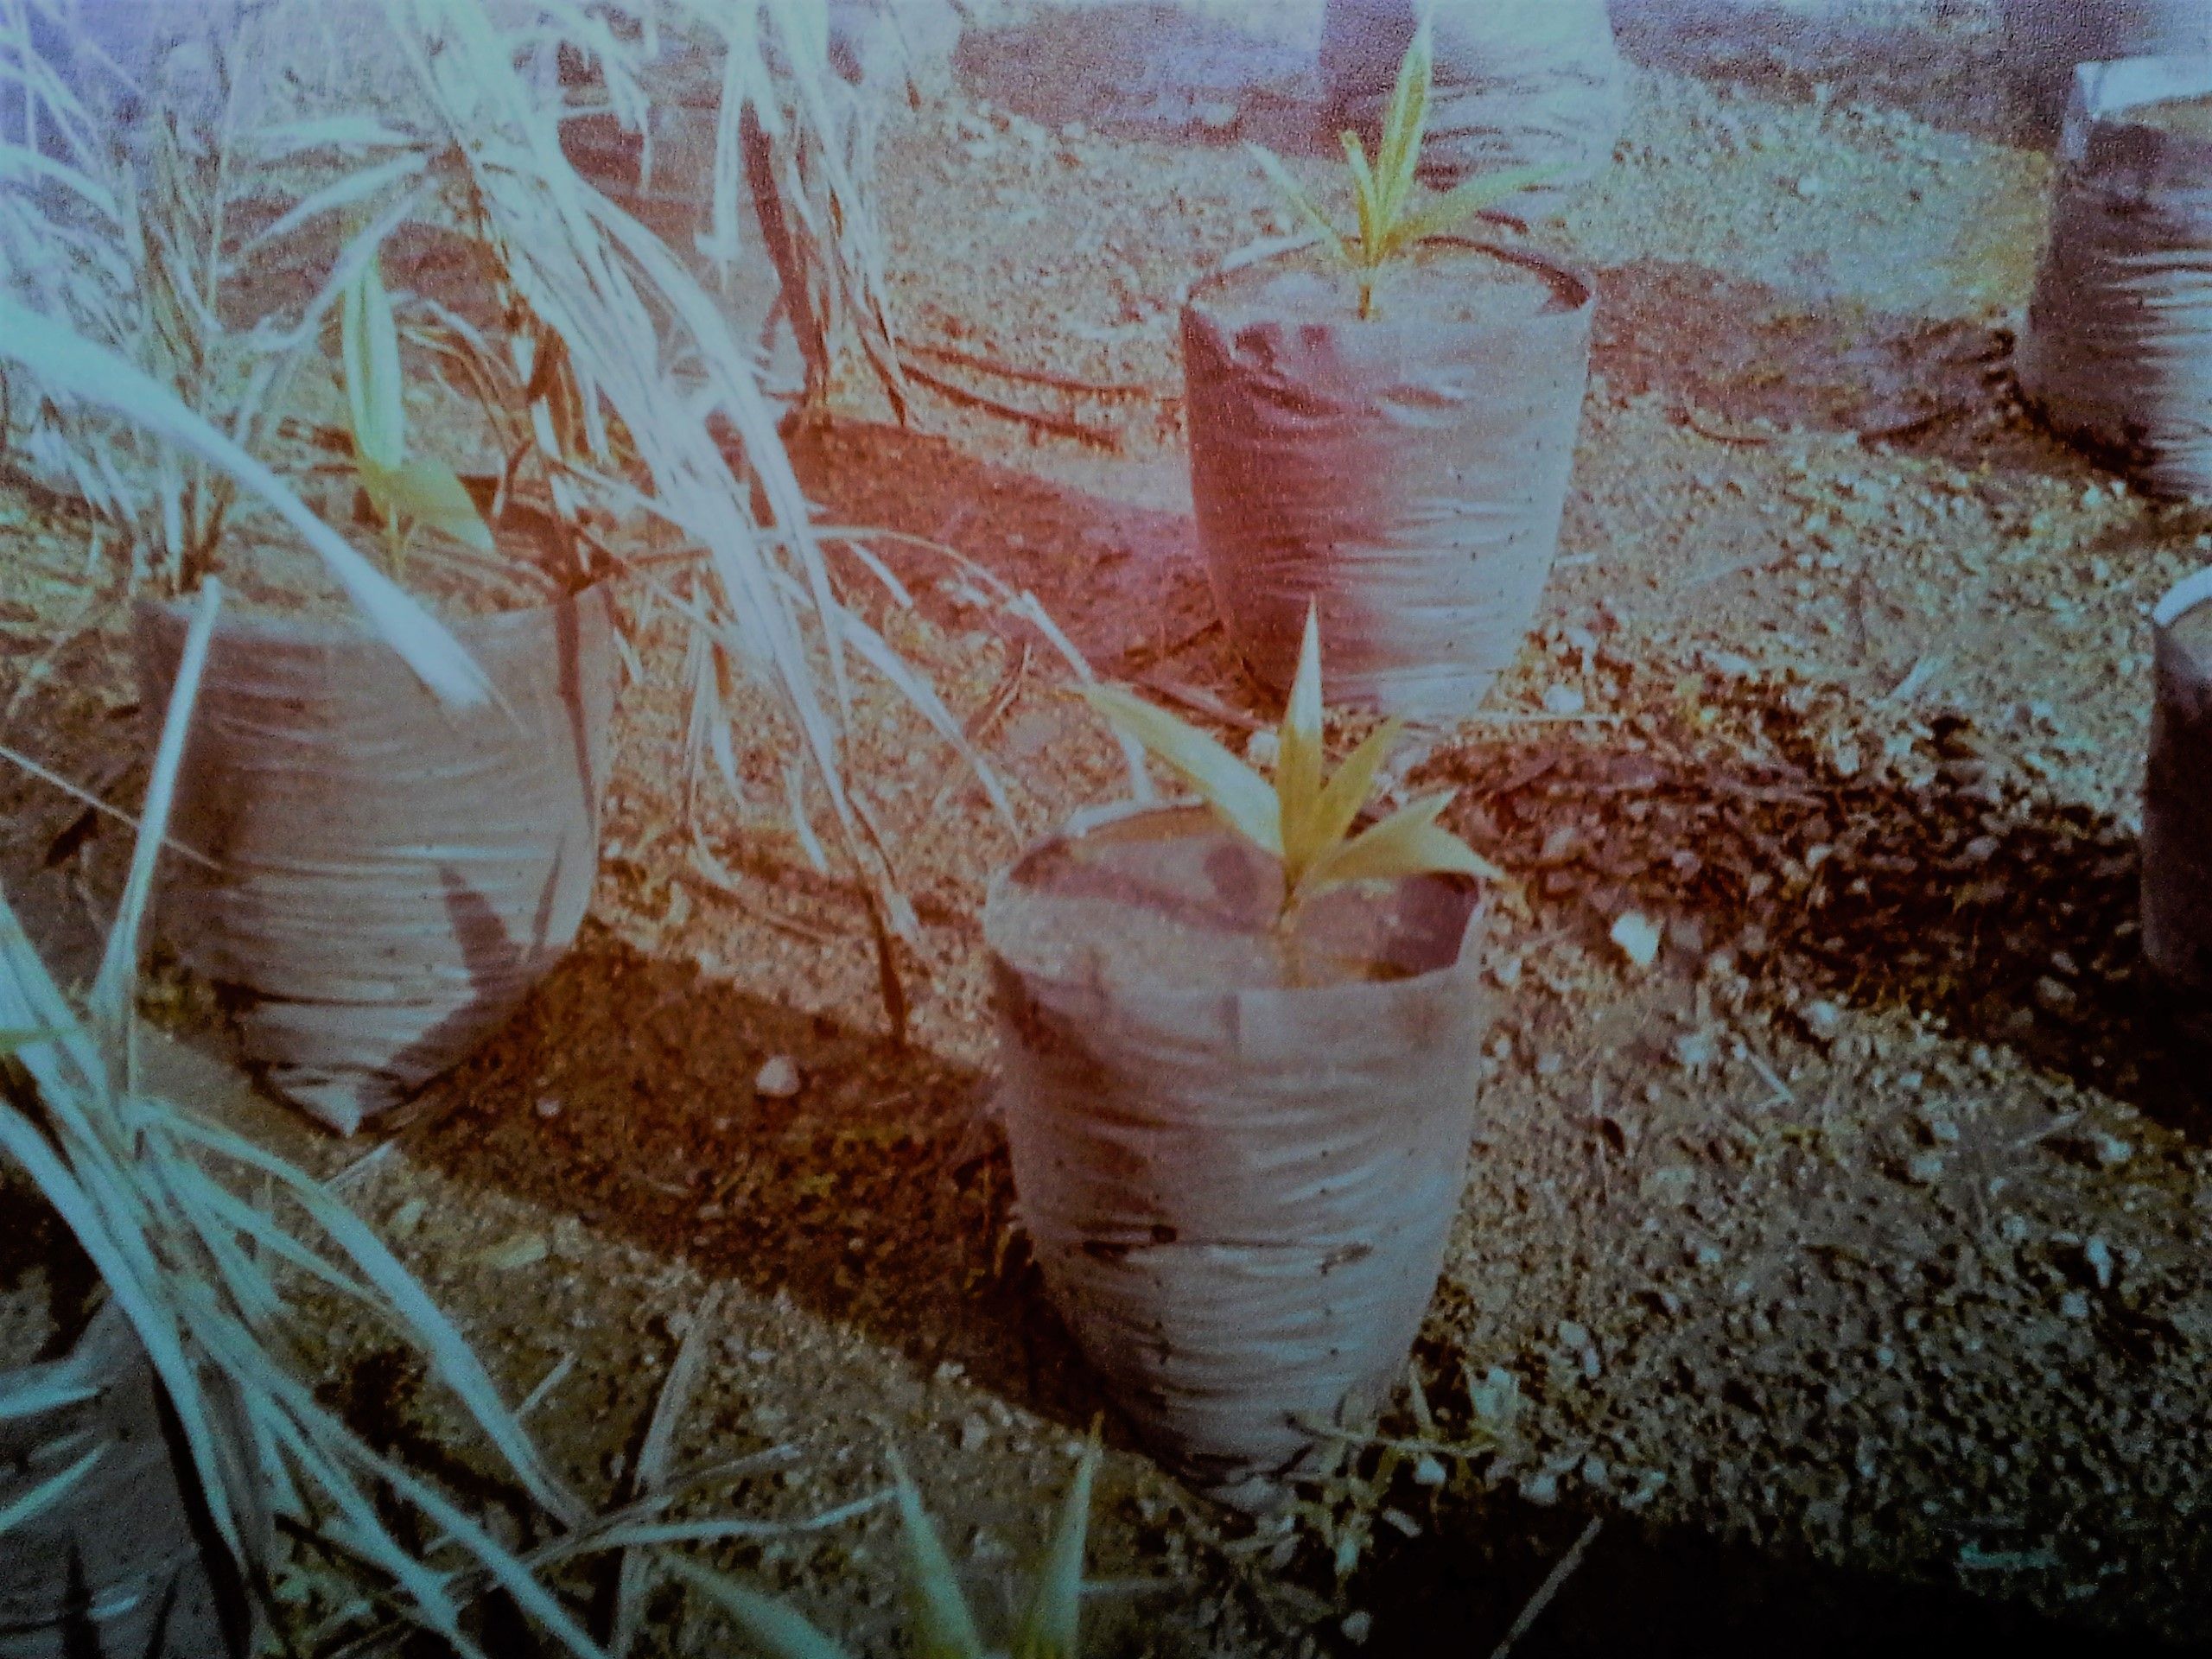
Experiments done for oil palm Elaeis guineensis (anonymous, 1981), for sunflower Helianthus anuus (Pieters, 1985) and for soybean Glycine max (Harris et al., 1986) gave the necessary data. For the methods see the publications listed.
Pieters (1985) measured only the leaf length. So, an additional experiment was necessary to proof that the length is a good estimator of the leaf surface, as Kerkhoff (1978) stated before.
Pieters also measured only the even leaves. Extrapolation resulted in values for the uneven leaves.
Results and Discussion
First phase growth leaf area oil palm
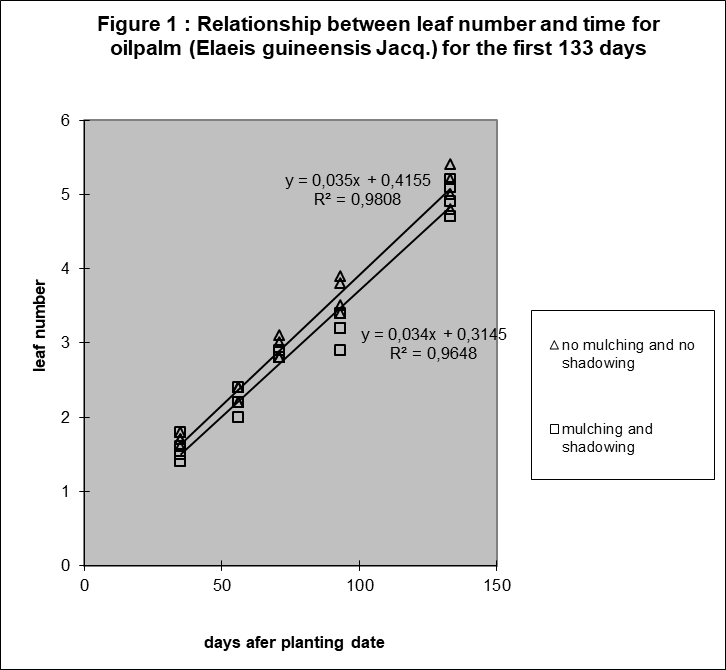
The following observation was surprising in 1981: The relation between leaf number of oil palm and time was linear in the period until day 133 after germination (figure 1).
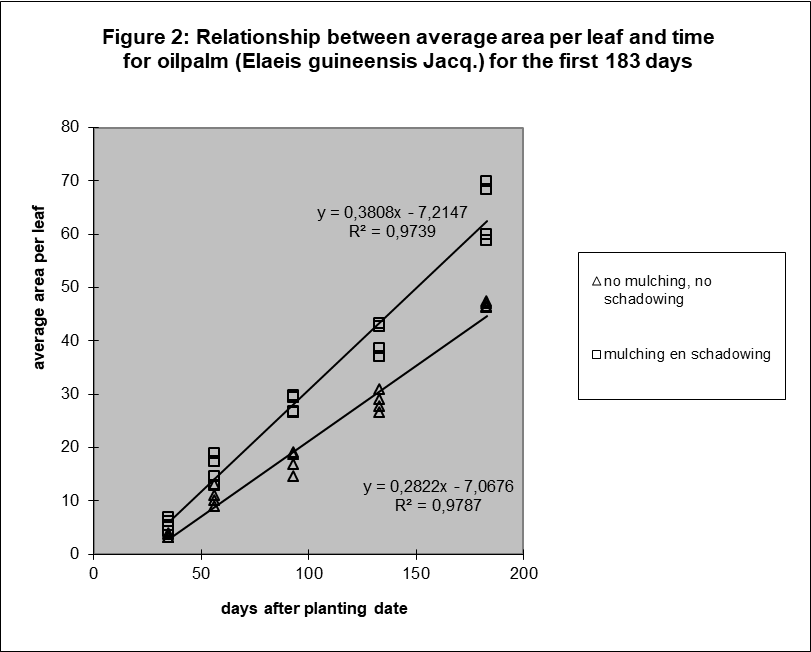
The relation between average surface per leaf and time was also surprisingly linear (figure 2). See Appendix A for the discussion of the statistical evidence.
If the two components average leaf number per plant (nL(t)) and average area per leaf (yLA(t)) show a linear relation with time, the product of these two (yTA(t)) will increase with the square root of time. In other words, the function describing the relation between total leaf area and time is a polynomial of the second order. This was also surprising, since we expected exponentially growth.
Research with soybean confirmed the findings of the first phase in the growth of oil palm
The question is if there is any confirmation of these observations in literature. The research of Harris et al. (1986) with soybean gave a good opportunity. However, counting the leaves was a problem. Soybean produces first photosynthetic hypocotyls, then primary leaves and finally the secondary leaves consisting of three leaflets. To suppose that these morphological different parts of the plant should be seen as a leaf, seemed premature. Therefore, recalling the results of oil palm, a development unit was defined as a unit leading to a linear relation between the amount of this unit and time. Trial and error resulted in the following thesis: a development unit = two hypocotyls = two primary leaves = one secondary leaf. The resulting linearity is illustrated in figure 3.
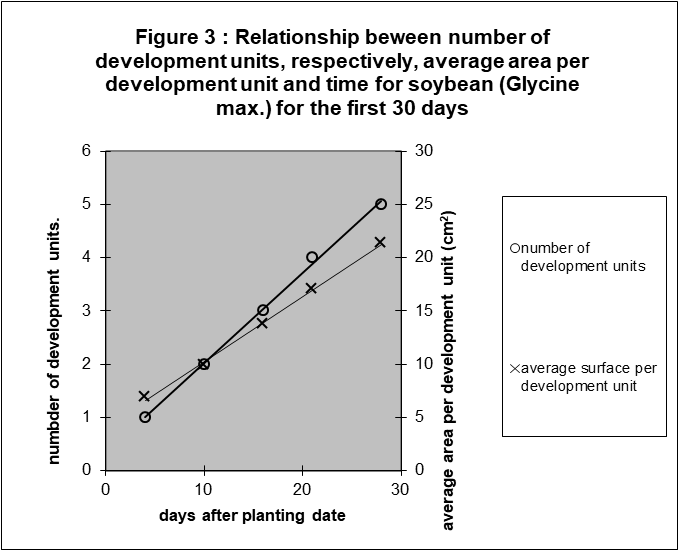
Of course, linearity is not interesting anymore by the recursive definition. But it is surely interesting that the other component, the average surface per development unit, increases also linearly with time. No testing was possible, as there were no repetitions available. However, the linearity is so obvious, see figure 3.
Second phase growth leaf area oil palm
The number of leaves in oil palm increases also linearly with time after 133 days, only with a different slope (figure 4). See for the statistical evidence Appendix A.

The growth rate of the other component, the average surface per leaf as function of time, increased also after day 183 (see figure 5).

It was not possible to proof linearity, as there were only two sample dates. However, analysing the results in another way, by plotting all the results of the mean leaf surface against the mean leaf number provides interesting insight, see figure 6.
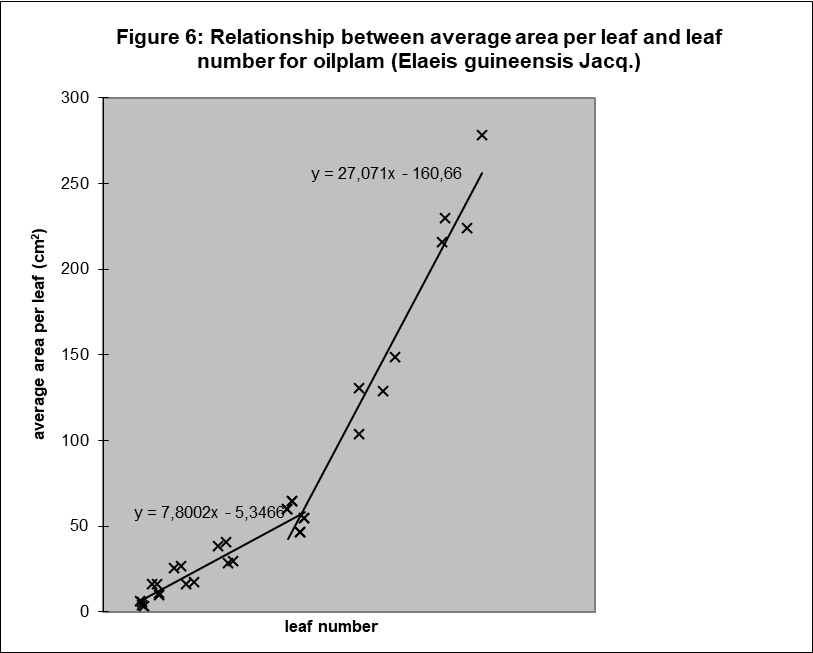
If the relation between these two components is linear after day 183, as the chart clearly suggests, and the relation between leaf number and time is linear, then the relation between average surface per leaf and time is also linear.
It implies that the total leaf surface increases again after day 183 with the square of time.
Research with sunflower confirms the findings of the growth of oil palm in both phases.
An experiment with sunflower (Pieters, 1985) gives the same results.
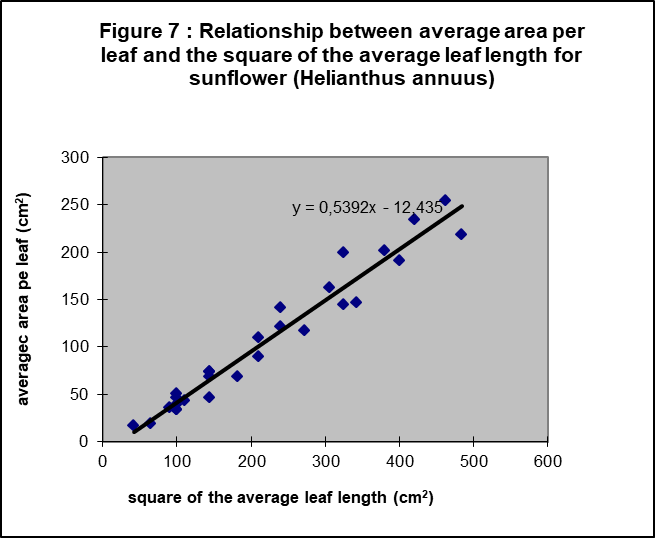
First, a test was necessary to assess if the leaf length is a good estimator for leaf area. Figure 7 shows it is.
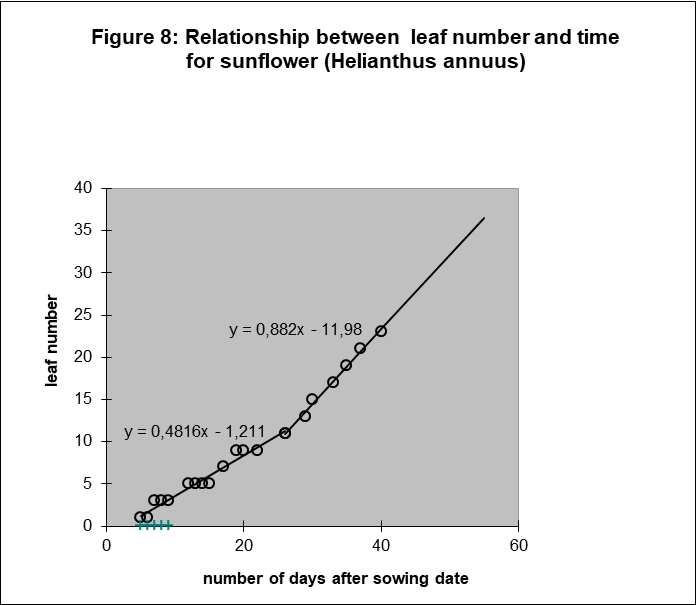
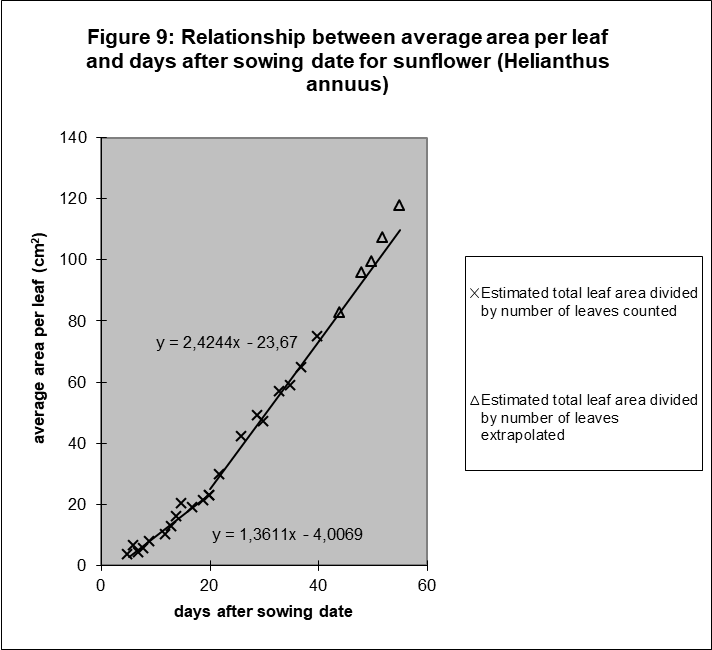
Next, Figure 8 and 9 show the results for sunflower and oil palm to be surprisingly similar. Leaf number and average surface per leaf are again linearly related to time, if we consider again two phases. Extrapolating the line for leaf number of sunflower when no more leaves appear. i.e. when the flower tissues are constructed, is interesting because the average surface per leaf stays also linearly related to time for a long period. Only In the latest growth period the growth rate of the average leaf area increases again.
An explanation for the different phases in the growth of leaf area
A plant has different energy providers in different periods: the endosperm of the seed in the first phase and later the photosynthesis. It may explain the partition of the growth in phases. The endosperm of oil palm is only consumed after 12 weeks. But, the change in appearance rate of he leaves and leaf surface growth rate is much later, after 130 and 180 days respectively. Explanations are:
- The regulating systems will need some time to switch from optimizing the conditions for endosperm consumption to optimizing them for photosynthesis.
- Time passes from the moment of the switch to photosynthesis and the first appearance of a leaf produced entirely by photosynthesis.
- Time passes before the plant has broken down the typical organ necessary for endosperm consumption, i.e. the haustorium, and has recycled the building material.
Notice:
- In a generative phase, the energy provision can change as the plant can relocate all the energy towards the seed.
- As stated in the introduction we assumed that the leaf surface was representative for plant production, arguing that leaves are the source for the plant mass production. Of course, one can object that leaf surface is not the main generator of plant mass in the seed dependent phase, because the haustorium is. But we will see in (link.1) that in a model supporting second order polynomial growth, not only the sources of production but also the sinks will show this pattern. So our assumption that leaf surface is representative for at least the pattern of plant growth remains in this case valuable, even for the seed dependent part.
Summary
The analysis of experiments showed plants (oil palm, soybean and sunflower) to grow with the square root of time if we consider two phases: the seed dependent and the photosynthesis dependent phase. There is an intermediate because of the faster change in phase of one linear component in comparison to the other. The linear components are the number of leaves and the average area per leaf.
The model in equations is as follows:
Seed-dependent vegetative phase:
y = (ct + d) (mt + nt)
Intermediate:
y = (ct + d) (ot + p) or y = (qt + r) (mt + nt)
Photosynthesis-dependent vegetative phase:
y = (qt + r) (ot + p)
Where
y = total leaf area of a plant
t = time
ct + d = leaf number as a linear function of time in the seed-dependent phase
mt + nt = average area per leaf as a linear function of time in the photosynthesis-dependent phase
qt + r = leaf number as a linear function of time in the photosynthesis-dependent phase
ot + p = average area per leaf as a linear function of time in the seed-dependent phase
c,d,m,n,q,r,o,p = parameters
The plants did not, as we expected, grow exponentially in the beginning.
Appendix A: Statistical evidence for linearity
Linearity is tested statistically by the method recommended by Causton and Venus (1981). The results for the component leaf number are summarized in table 1. A high F-ratio means high deviation form linearity.
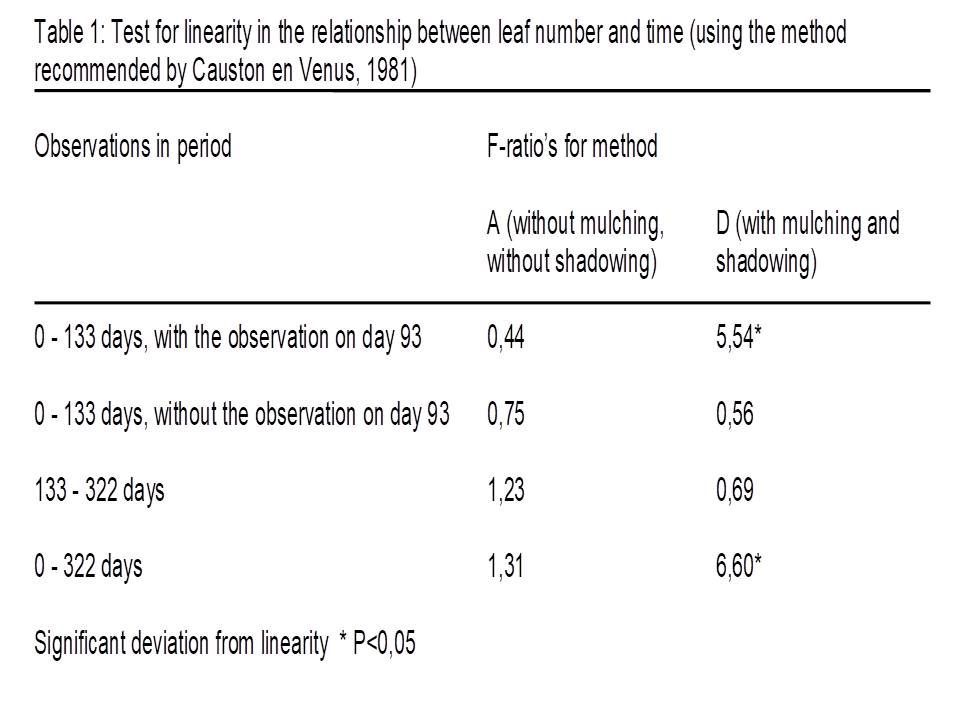
Method D showed a significant deviation from linearity, but it seems to be related to a temporarily setback in growth after the removal of shadowing after day 93. There is no significant deviation if the observation of day 93 is omitted.
The conclusion from this test is that average leaf size is linearly related with time for method D (mulching and shadowing), see table 2. It was not immediately possible for method A (no mulching, no shadowing) because of the significant deviation.
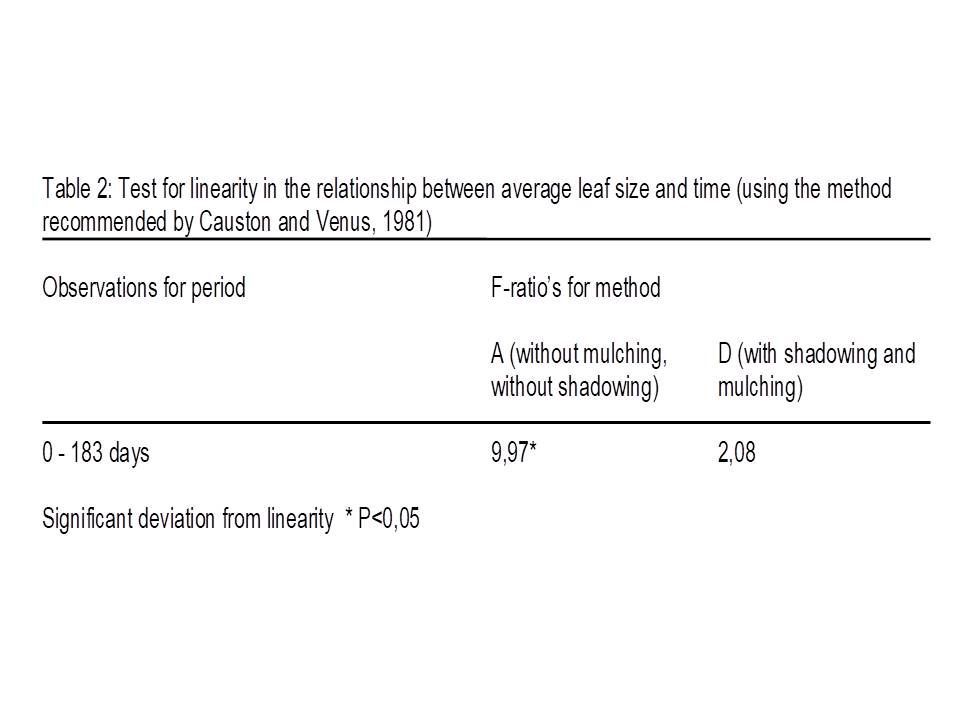
But, figure 2 shows that the sample averages of both methods, the significant A and the non-significant D, are positioned on exact the same way relative to the regression line. The individual results on a sample date of method A are closer together. So, the test detects for method A the small fluctuations around the line. It can be explained by fluctuations in circumstances. The experiment was done outside.
References
Causton, D.R. & J.C. Venus, 1981. The Biometry of Plant Growth. Edward Arnold, London.
Anonymous, 1981. A comparison of nursery-techniques for oil-palm by means of a growth analysis (Dutch). Thesis, Department of Tropical Crop science, Agric. Univ., Wageningen.
Harris, M., D.L. Smith & R.O. Mackender, 1986. Growth analysis of soybean seedlings during the lifespan of the cotyledons. Annals of Botany 57: 69-79.
Kerkhoff, P., 1978. The effect of temperature and day length on the growth and development of Helianthus annuus (Dutch). Thesis (unpublished), Department of Plant Physiological Research, Agr. Univ., Wageningen.
Pieters, G.A., 1985. Effects of radiation level on leaf growth of sunflower. Physiologia Plantarum 65: 263-269.