Introduction
The conclusion in a previous paper (link.1)was that plants (oil palm, soybean and sunflower) grow with the square root of time if we consider two phases: the seed dependent and the photosynthesis dependent phase. There is an intermediate phase because of the faster change in growth rate of one linear component in comparison to the other. The linear components are the number of leaves and the average area per leaf.
Thus, the model in equations is as follows:
Seed-dependent vegetative phase: y = (ct + d) (mt + nt)
Intermediate : y = (ct + d) (ot + p) or y = (qt + r) (mt + nt)
Photosynthesis-dependent vegetative phase: y = (qt + r) (ot + p)
Where
y = total leaf area of a plant
t = time
ct + d = leaf number as a linear function of time in the seed-dependent phase
mt + nt = average area per leaf as a linear function of time in the seed-dependent phase
qt + r = leaf number as a linear function of time in the photosynthesis-dependent phase
ot + p = average area per leaf as a linear function of time in the photosynthesis-dependent phase
c,d,m,n,q,r,o,p = parameters
Methods
We compared this model with the one equation models mentioned in by Thornley (1990): the Chanter-equation, the Gompertz-equation and the logistic curve.
The results of the experiment of Pieters (1985) are used (see also link.1).
Leaf area is evaluated and not plant mass. But the characteristic of the growth should be equal, when, as Thornley (1990) stated for the one equation models, the ratio between the growth machinery, i.e. the leaf area, and the total plant, i.e. the plant mass, does not change.
We evaluated the natural logarithm of the leaf area, as exponential growth implicates a linear relation between it with time. Most scientists (see link.2) expect exponential growth in the beginning of plant live. The new model is challenging this and so it was important to make the difference clear.
It was not possible to find a transformation for the models in each other. Therefore, it was not possible to prove that one of the models perform statistically better than the other. However, it was possible to analyse the variances and to show which model produces the best fitting curve, i.e. the lowest variance.
Finding the best fitting curve was very simple for the newly presented model, i.e. the polynomial of the second order with the three phases: The regression lines for both components where multiplied. Thus, see also link.1:
From day 1 until 18,5 : (0,4816t – 1,211) * (1,3611t – 4,0069)
From day 18,5 until 26,9 : (0,4816t – 1,211) * (2,4244t – 23,27)
From day 26,9 until 59 : (0,882t -11,98) * (2,4244t – 23,27)
The variance of the obtained curve is determined with a specially developed computer program, which computed the smallest distance between the (natural logarithm of the) measured points and the curve. The variance is the sum of the smallest distances divided by the number of observations.
The same computer program is used to determine the variance of the curves produced by De Chanter-equation, the Gompertz-equation and the logistic curve, respectively. The parameters of the equations are varied with the help of the optimizer function in the software Excel in such a way that the best fitting curves were found.
Results and discussion
The variances are represented in table1.
Table 1: Variances of the best fitting curves of growth models for the leaf surface area of sunflower (data from Pieters, 1985)
| Model | ||||
| logistic | Gompertz | De Chanter | polynomial of the second order with three phases | |
| variance | 0,1043 | 0,0206 | 0,0206 | 0,0036 |
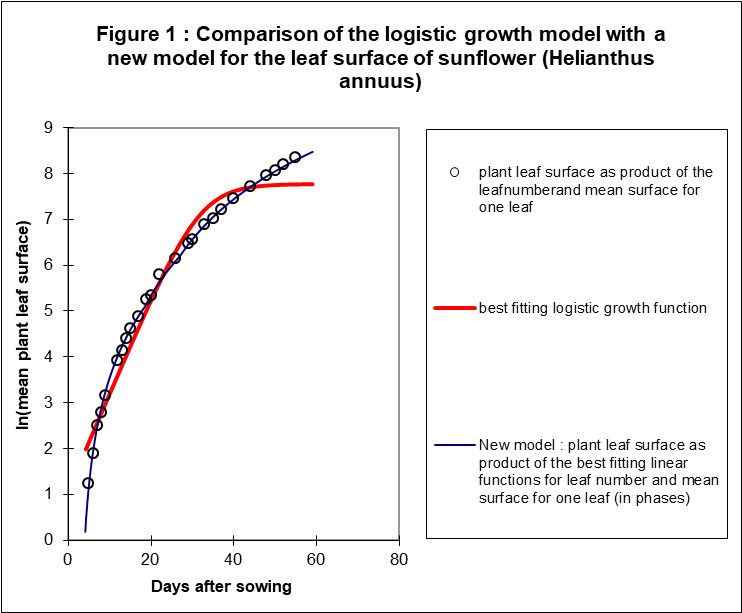
The new model, i.e. the polynomial of the second order, is the best fitting by far. The logistic model is the worst fitting, see figure 1. The basic idea, exponential growth in the beginning, a linear relation between natural logarithm of leaf area and time is clearly not correct. The other idea, a horizontal line, a constant growth at the end, is also not correct for an individual plant with no restriction in space.
references
Pieters, G.A., 1985. Effects of radiation level on leaf growth of sunflower. Physiologia Plantarum 65: 263-269.
Thornley. J.H.M. and I.B. Johnson, 1990. Plant and Crop Modelling: A Mathematical Approach to Plant and Crop Physiology. Clarendon, Oxford.